Over its short life, the Visual Studio Code editor has made itself remarkably popular. Visual Studio Code provides developers with a new choice of developer tool that combines the simplicity and streamlined experience of a code editor with the best of what developers need for their core code-edit-debug cycle.
After getting the numerous requests from JAVA developers, Microsoft has open sourced the Java debugger extension for Visual Studio Code and backend Java Debug Server. Within few days the Java debugger extension has been installed over 56,000 times from visual studio code marketplace and getting good reviews from Java developers.
With this, the developer can debug with third-party classes. when the source code is inside a JAR or a source attachment. And also can set a breakpoint in those classes ahead of debugging.
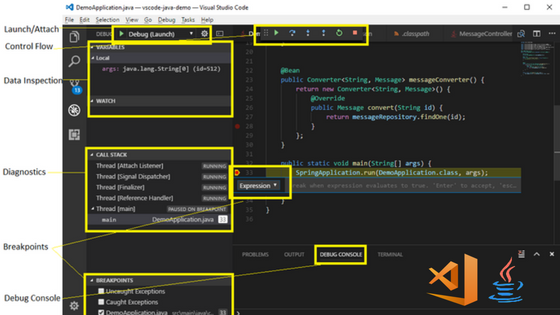
Here’s a list of features:
- Launch/Attach
- Breakpoints
- Exceptions
- Pause & Continue
- Step In/Out/Over
- Variables
- Call stacks
- Threads
- Debug console
How to install java debugger on visual studio code?.
Method 1 :
In Visual Studio Code, open the Extensions view (Ctrl+Shift+X).
Type “java” to filter the list.
Find and install the Java Extension Pack or standalone Java Debugger for Visual Studio Code extension if you already have Language Support for Java(TM) by Red Hat installed.
Method 2 :
Open VS Code and press F1 or (Ctrl + Shift + P) to open command palette, select Install Extension and type vscode-java-debug.
Or launch VS Code Quick Open (Ctrl + P), paste the following command, and press enter.
ext install vscode-java-debug
Method 3 :
To start Java developers with VS Code quickly install Java Extension Pack which includes both the Language Support for Java(TM) by Red Hat and Java Debugger for Visual Studio Code.
We can expect many advanced updates in these coming days.